"Lag" is every Minecraft server administrator's nightmare. Whether it's constant slowdowns, sudden freezes, or blocks reappearing, performance issues can ruin the gaming experience. Fortunately, there are powerful tools to precisely identify the sources of this lag. Among them, Spark stands out as an indispensable profiling tool, compatible with almost all versions of Minecraft.
This guide will walk you step-by-step through installing and using Spark to analyze your server's performance, understand the generated reports, and identify the culprits responsible for the lag.
Installing Spark
Before you can analyze anything, you need to install Spark on your server. To do this, please follow these steps, depending on the type of server you are using:
- If you are playing with a modpack (using a modded server):
- You'll need to determine whether it uses Forge, Fabric, or NeoForge in order to download the corresponding version of Spark: https://www.curseforge.com/minecraft/mc-mods/spark/files.
- Then, place the downloaded
.jarfile into your server'smodsfolder.
- If you specifically chose a Vanilla or Snapshot version during installation: You will first need to migrate to Paper to use Spark. To do this, go to the Quick Install tab to install Paper (be sure not to check the box to reinstall the server so as not to lose all your data).
- Plugin Version (Spigot/Paper/Purpur etc.):
- Download the latest version from SpigotMC: https://www.spigotmc.org/resources/spark.57242/
- Place the downloaded
.jarfile in your server'spluginsfolder.
Once the file has been added to the correct folder, completely restart your server for Spark to load correctly.
Checking the server status
The first step in diagnosing lag is to check the overall health of your server. Spark provides a simple and effective command for this:
/spark tps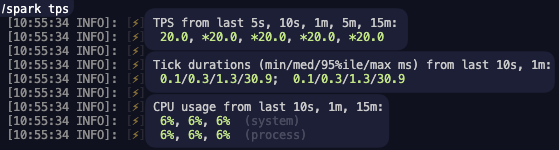
This command displays several crucial pieces of information:
TPS (Ticks Per Second): Like a human's heart, your server's heart beats at an ideal rate of 20 TPS. Each "tick" represents an update to the game (creature movement, plant growth, etc.).
20 TPS: Your server is in perfect health.
Between 18 and 19.9 TPS: Slight slowdowns may occur, often imperceptible.
Below 18 TPS: Lag becomes noticeable and the gaming experience deteriorates. The lower this number, the more severe the lag.
Tick durations (also called MSPT): This is the time (in milliseconds) it takes your server to calculate a single tick. To maintain 20 TPS, the server must perform each tick in 50 ms or less (1000 ms / 20 ticks = 50 ms/tick).
<= 50 ms: Ideal, corresponds to 20 TPS.
> 50 ms: The server is taking too long per tick, leading to a drop in TPS and thus lag. This is often a more accurate indicator than TPS for spotting occasional overloads.
CPU usage: Indicates the processor load generated by the Minecraft process. Constantly high CPU usage (close to 100% on one or more cores, depending on your machine) may indicate that the server is reaching its limits.
Identifying the sources of lag with the profiler
Spark's profiler is the primary tool for understanding what requires the most processing power from your server. It records server activity for a defined period and generates a detailed report.
Generating the Spark report
Depending on the type of slowdown observed in the game, you can use two different commands:
Lag is constant
In the case of constant slowdowns on the server, you can run the following command:
/spark profiler start --timeout 30This command will start an analysis for 30 seconds. You can adjust the duration, for example, 60 for one minute (30 to 60 seconds is generally enough to collect sufficient data).
Lag is short and sudden (sudden TPS drops)
It may happen that the lag is not constant but rather random and sudden. In this case, we will run a different command to isolate the moments of slowdown in order to highlight them in the report:
/spark profiler start --only-ticks-over 70 --timeout 60In this case:
--only-ticks-over 70: Only records information from ticks that took more than 70 ms to execute (ticks causing noticeable lag). Adjust this value (in ms) if necessary. 50 ms corresponds to the limit for 20 TPS, so a value like 70 or 100 is a good starting point for targeting peaks.--timeout 60: The analysis will last 60 seconds, but will only collect data during the lag spikes defined by the previous threshold.
Understanding the report
Once the command is executed, you should receive a link to the Spark report after the specified duration (via the --timeout argument) has elapsed.
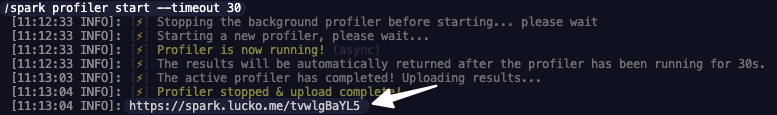
The Spark Viewer presents the collected data in an organized manner.
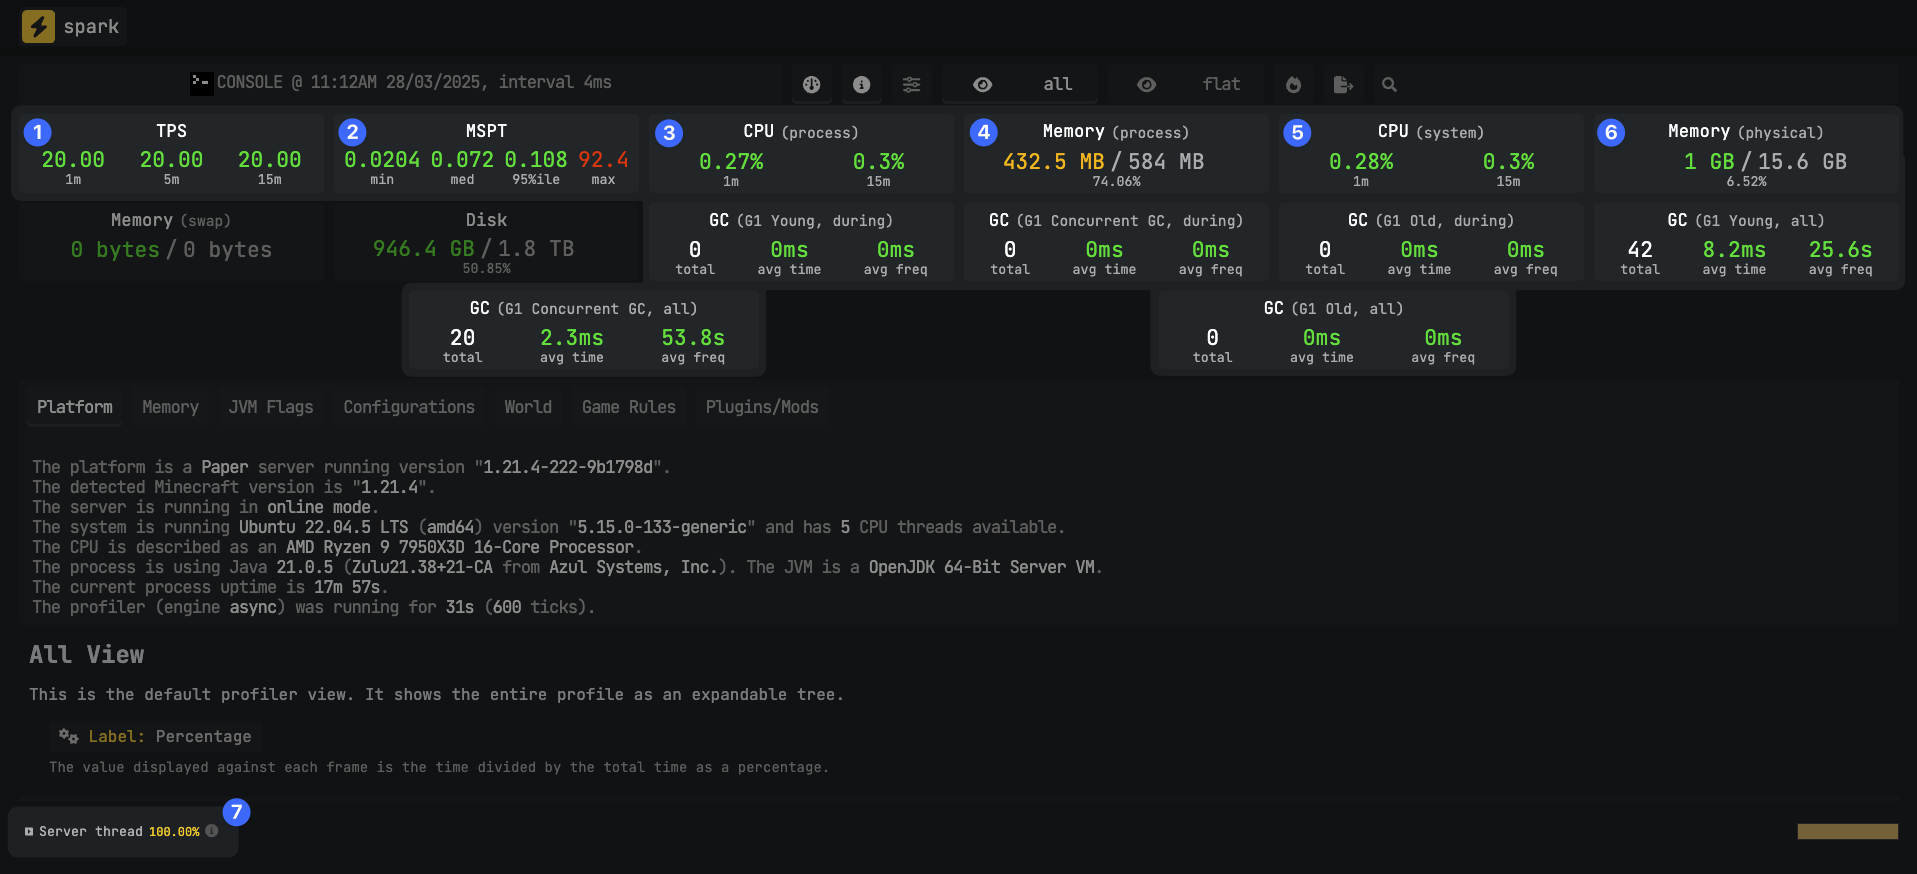
Here's how to interpret it:
- 1. As seen previously, the first box indicates the TPS of your server during the report generation.
- 2. The same goes for the tick duration.
- 3. The CPU box indicates the server load during report generation.
- 4. This box indicates the amount of RAM used by the Minecraft process. This value does not correspond to the amount of memory available for your server. The limit of this value is not fixed and is dynamically adjusted by Minecraft.
- 5. The system CPU is the same as the process CPU on Hosterfy servers.
- 6. Physical Memory corresponds to the total memory available for your Minecraft server. This value is fixed and defined according to the Minecraft server you have subscribed to.
- 7. The last line at the bottom of the page corresponds to the call tree, which can be expanded (see the next section).
You will also notice many boxes related to the GC (Garbage Collector). These indicate the health of this mechanism, which aims to manage the RAM not used by your Minecraft server, notably to free it up. Many orange or red values in these boxes may indicate a memory management problem. In this case, it is best to contact support so that you can be assisted in resolving this issue.
Analyzing the Call Tree
This part of the report is the most important for TPS issues. It shows how the computation time is distributed among the different operations performed by the server.
The elements are hierarchical. A line represents a function or task executed by the server.
The percentages indicate the proportion of the total analysis time consumed by this task and all the tasks it calls (% Total).
Start at the top (tick / Server thread) and expand the lines with the highest % Total percentages. Continue to descend into the hierarchy to refine your search.
Example of a Server with Low TPS
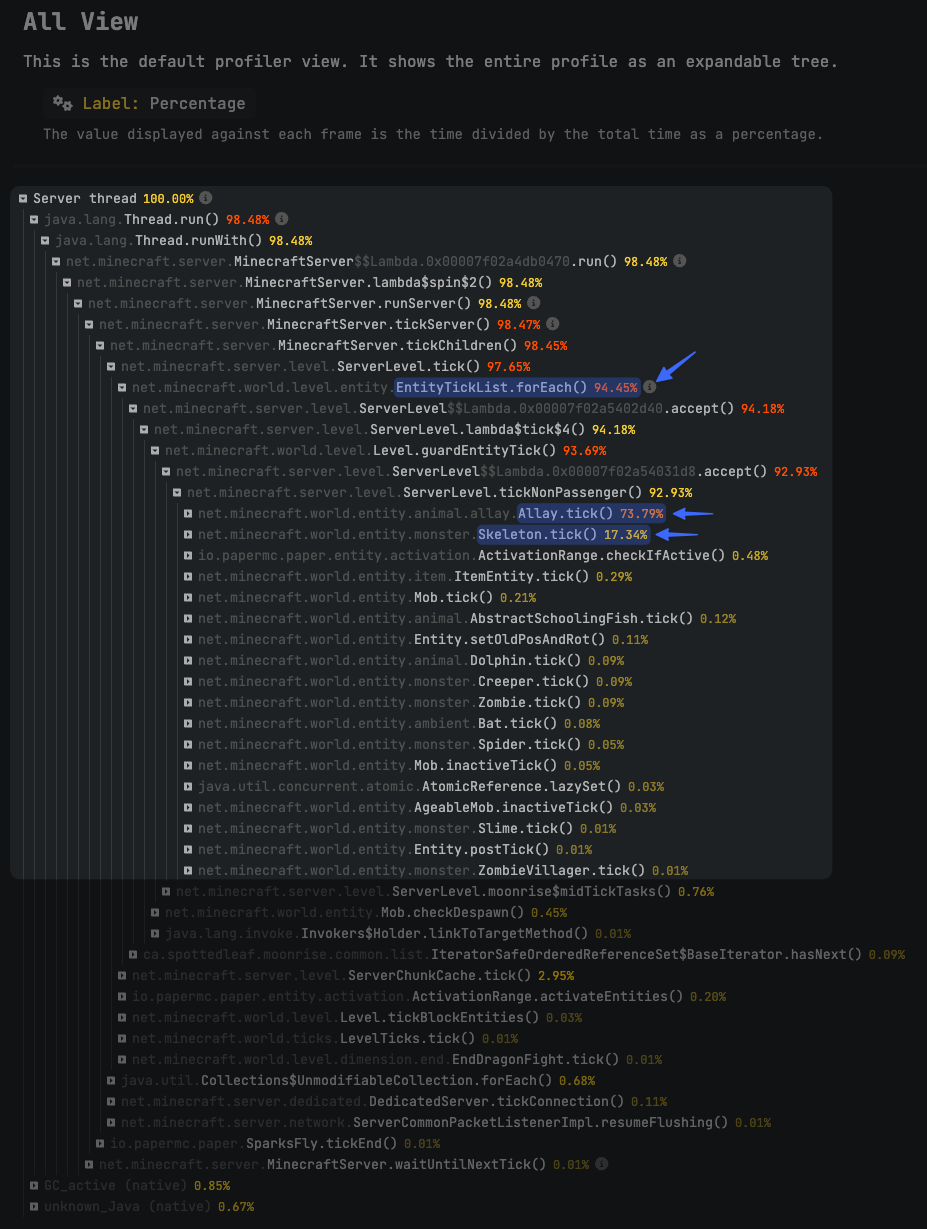
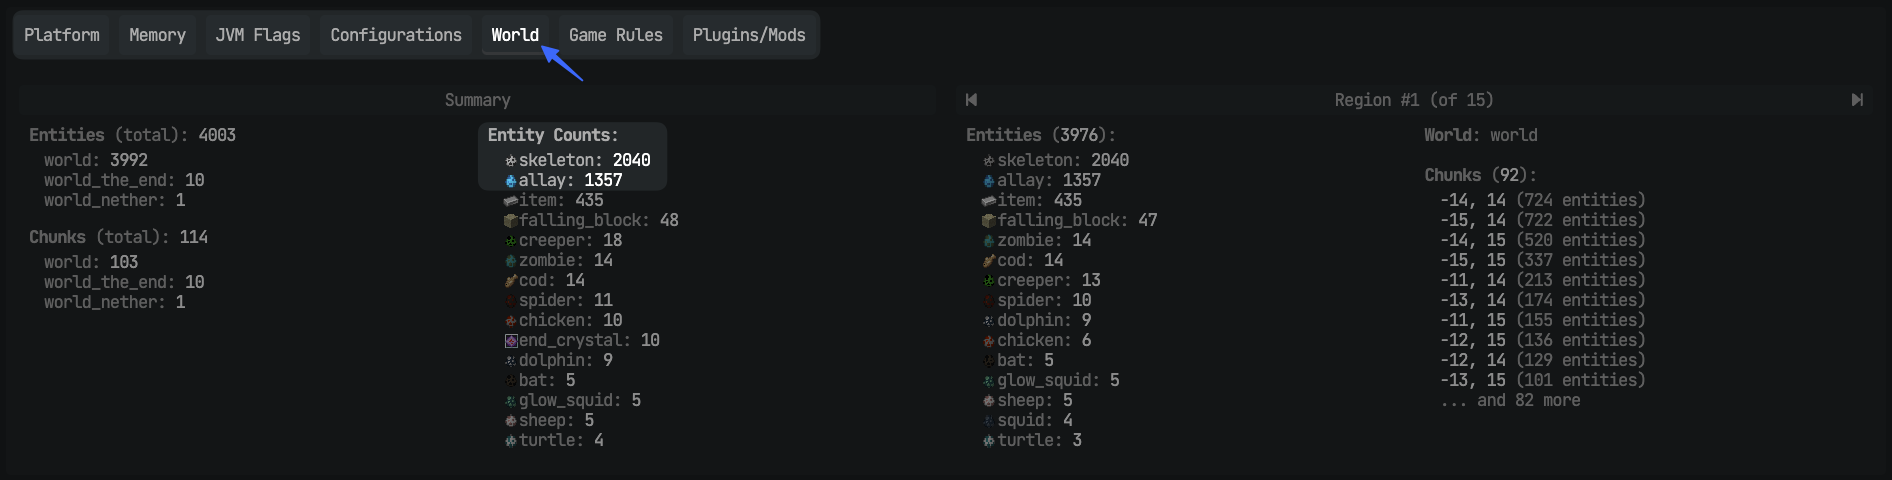
Thanks to Spark, in this case (following the methodology presented above), we observe that the vast majority of the time consumed by the server is dedicated to ticking entities, and more specifically Allays and Skeletons.
Indeed, if we look at the World tab available in the Spark report, we observe a significant number of these two entities on the server:
Other Spark commands
Spark offers other commands that can supplement your diagnosis:
/spark healthreport: Generates a comprehensive report on the state of your server, including TPS/MSPT, memory usage, disk usage, system information (CPU, OS, Java), and JVM startup arguments. It's excellent for getting an overview or for sharing information when you're asking for help./spark gc: Analyzes the activity of the Java Garbage Collector (GC). GC pauses that are too long or frequent can cause major server freezes. This command helps diagnose memory management issues./spark heapsummary: Creates a "dump" of the RAM (heap) to analyze which objects occupy the most space. Useful for problems of excessive RAM consumption, often in addition to a GC analysis.
We will not detail the analysis of these commands, but you can contact our support with these elements if you want assistance in determining the source of the lag.


Post a comment
Comments